Collect Docker metrics with Prometheus
Prometheus is an open-source systems monitoring and alerting toolkit. You can configure Docker as a Prometheus target.
WarningThe available metrics and the names of those metrics are in active development and may change at any time.
Currently, you can only monitor Docker itself. You can't currently monitor your application using the Docker target.
Example
The following example shows you how to configure your Docker daemon, set up Prometheus to run as a container on your local machine, and monitor your Docker instance using Prometheus.
Configure the daemon
To configure the Docker daemon as a Prometheus target, you need to specify the
metrics-address in the daemon.json configuration file. This daemon expects
the file to be located at one of the following locations by default. If the
file doesn't exist, create it.
- Linux:
/etc/docker/daemon.json - Windows Server:
C:\ProgramData\docker\config\daemon.json - Docker Desktop: Open the Docker Desktop settings and select Docker Engine to edit the file.
Add the following configuration:
{
  "metrics-addr": "127.0.0.1:9323"
}
Save the file, or in the case of Docker Desktop for Mac or Docker Desktop for Windows, save the configuration. Restart Docker.
Docker now exposes Prometheus-compatible metrics on port 9323 via the loopback
interface. You can configure it to use the wildcard address 0.0.0.0 instead,
but this will expose the Prometheus port to the wider network. Consider your
threat model carefully when deciding which option best suits your environment.
Create a Prometheus configuration
Copy the following configuration file and save it to a location of your choice,
for example /tmp/prometheus.yml. This is a stock Prometheus configuration file,
except for the addition of the Docker job definition at the bottom of the file.
# my global config
global:
  scrape_interval: 15s # Set the scrape interval to every 15 seconds. Default is every 1 minute.
  evaluation_interval: 15s # Evaluate rules every 15 seconds. The default is every 1 minute.
  # scrape_timeout is set to the global default (10s).

  # Attach these labels to any time series or alerts when communicating with
  # external systems (federation, remote storage, Alertmanager).
  external_labels:
    monitor: "codelab-monitor"

# Load rules once and periodically evaluate them according to the global 'evaluation_interval'.
rule_files:
  # - "first.rules"
  # - "second.rules"

# A scrape configuration containing exactly one endpoint to scrape:
# Here it's Prometheus itself.
scrape_configs:
  # The job name is added as a label `job=<job_name>` to any timeseries scraped from this config.
  - job_name: prometheus

    # metrics_path defaults to '/metrics'
    # scheme defaults to 'http'.

    static_configs:
      - targets: ["localhost:9090"]

  - job_name: docker
      # metrics_path defaults to '/metrics'
      # scheme defaults to 'http'.

    static_configs:
      - targets: ["host.docker.internal:9323"]
Run Prometheus in a container
Next, start a Prometheus container using this configuration.
$ docker run --name my-prometheus \
    --mount type=bind,source=/tmp/prometheus.yml,destination=/etc/prometheus/prometheus.yml \
    -p 9090:9090 \
    --add-host host.docker.internal=host-gateway \
    prom/prometheus
If you're using Docker Desktop, the --add-host flag is optional. This flag
makes sure that the host's internal IP gets exposed to the Prometheus
container. Docker Desktop does this by default. The host IP is exposed as the
host.docker.internal hostname. This matches the configuration defined in
prometheus.yml in the previous step.
Open the Prometheus Dashboard
Verify that the Docker target is listed at http://localhost:9090/targets/.
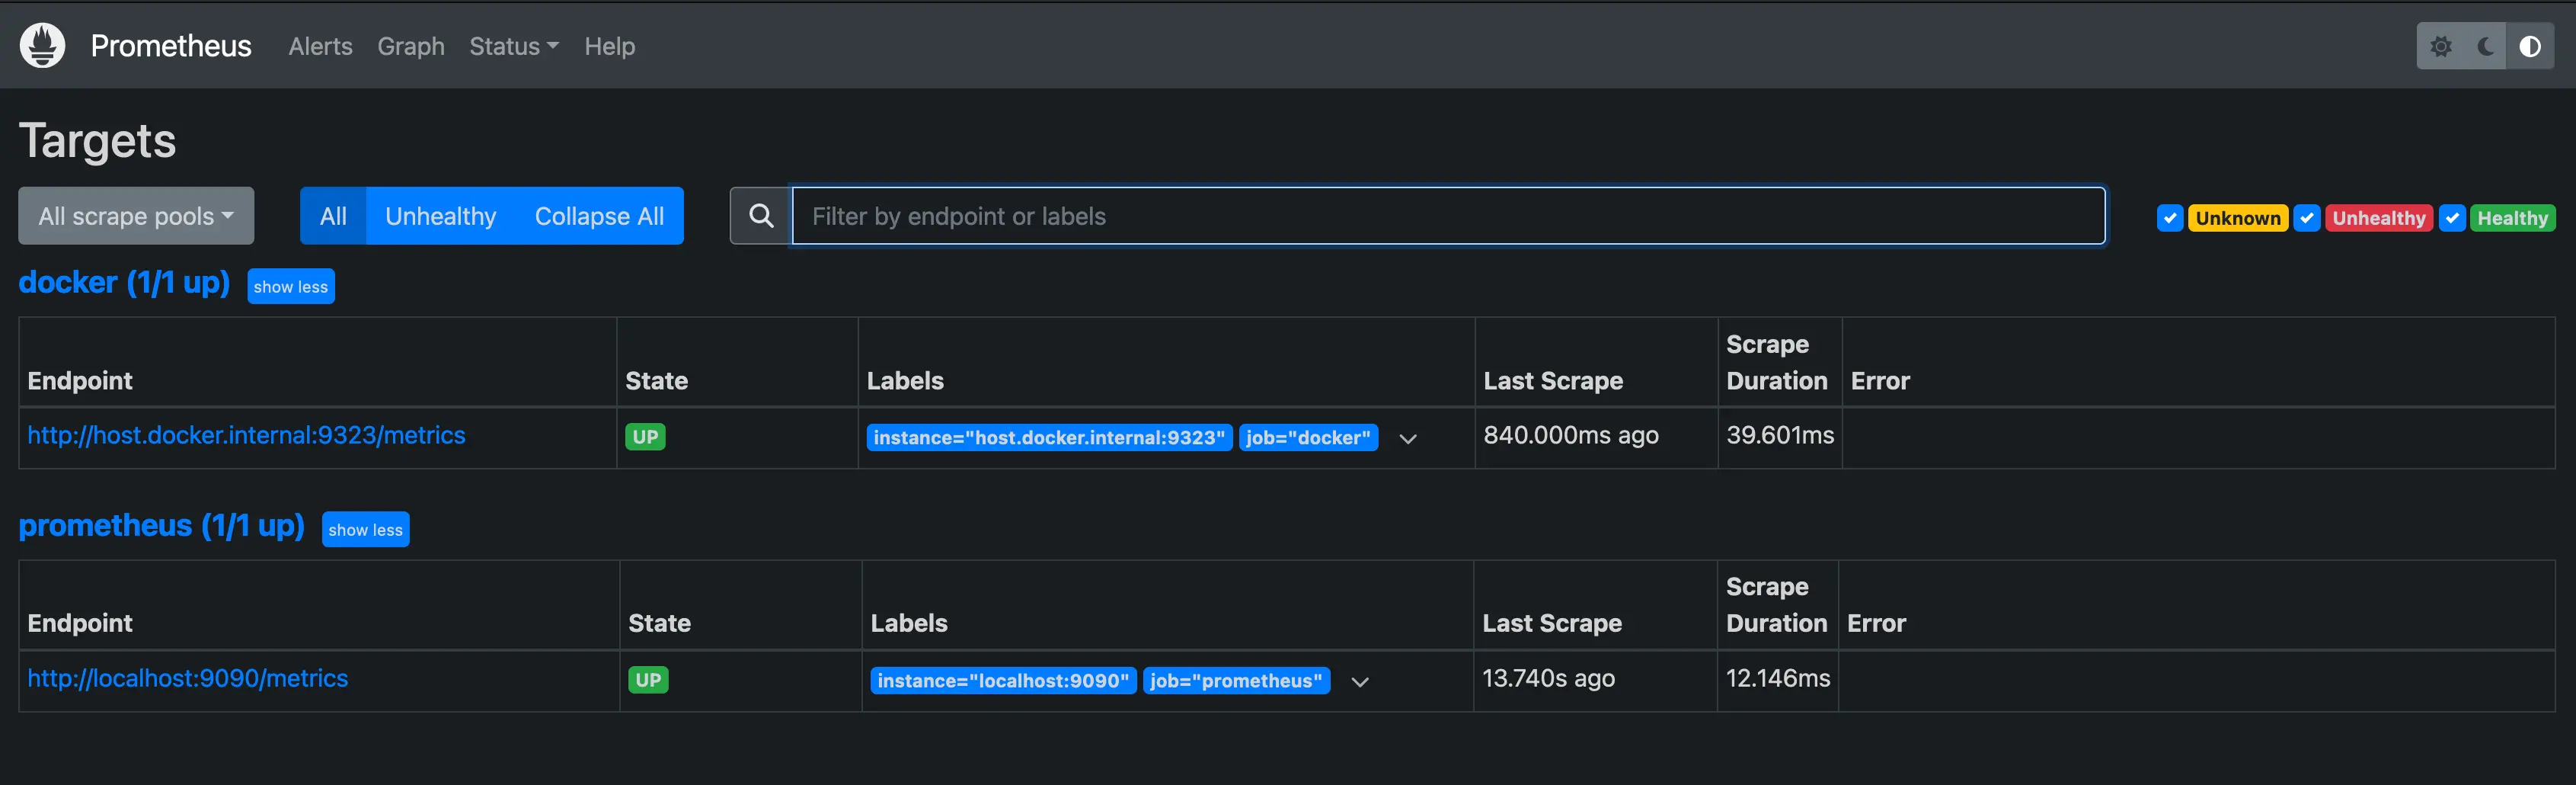
NoteYou can't access the endpoint URLs on this page directly if you use Docker Desktop.
Use Prometheus
Create a graph. Select the Graphs link in the Prometheus UI. Choose a metric
from the combo box to the right of the Execute button, and click
Execute. The screenshot below shows the graph for
engine_daemon_network_actions_seconds_count.
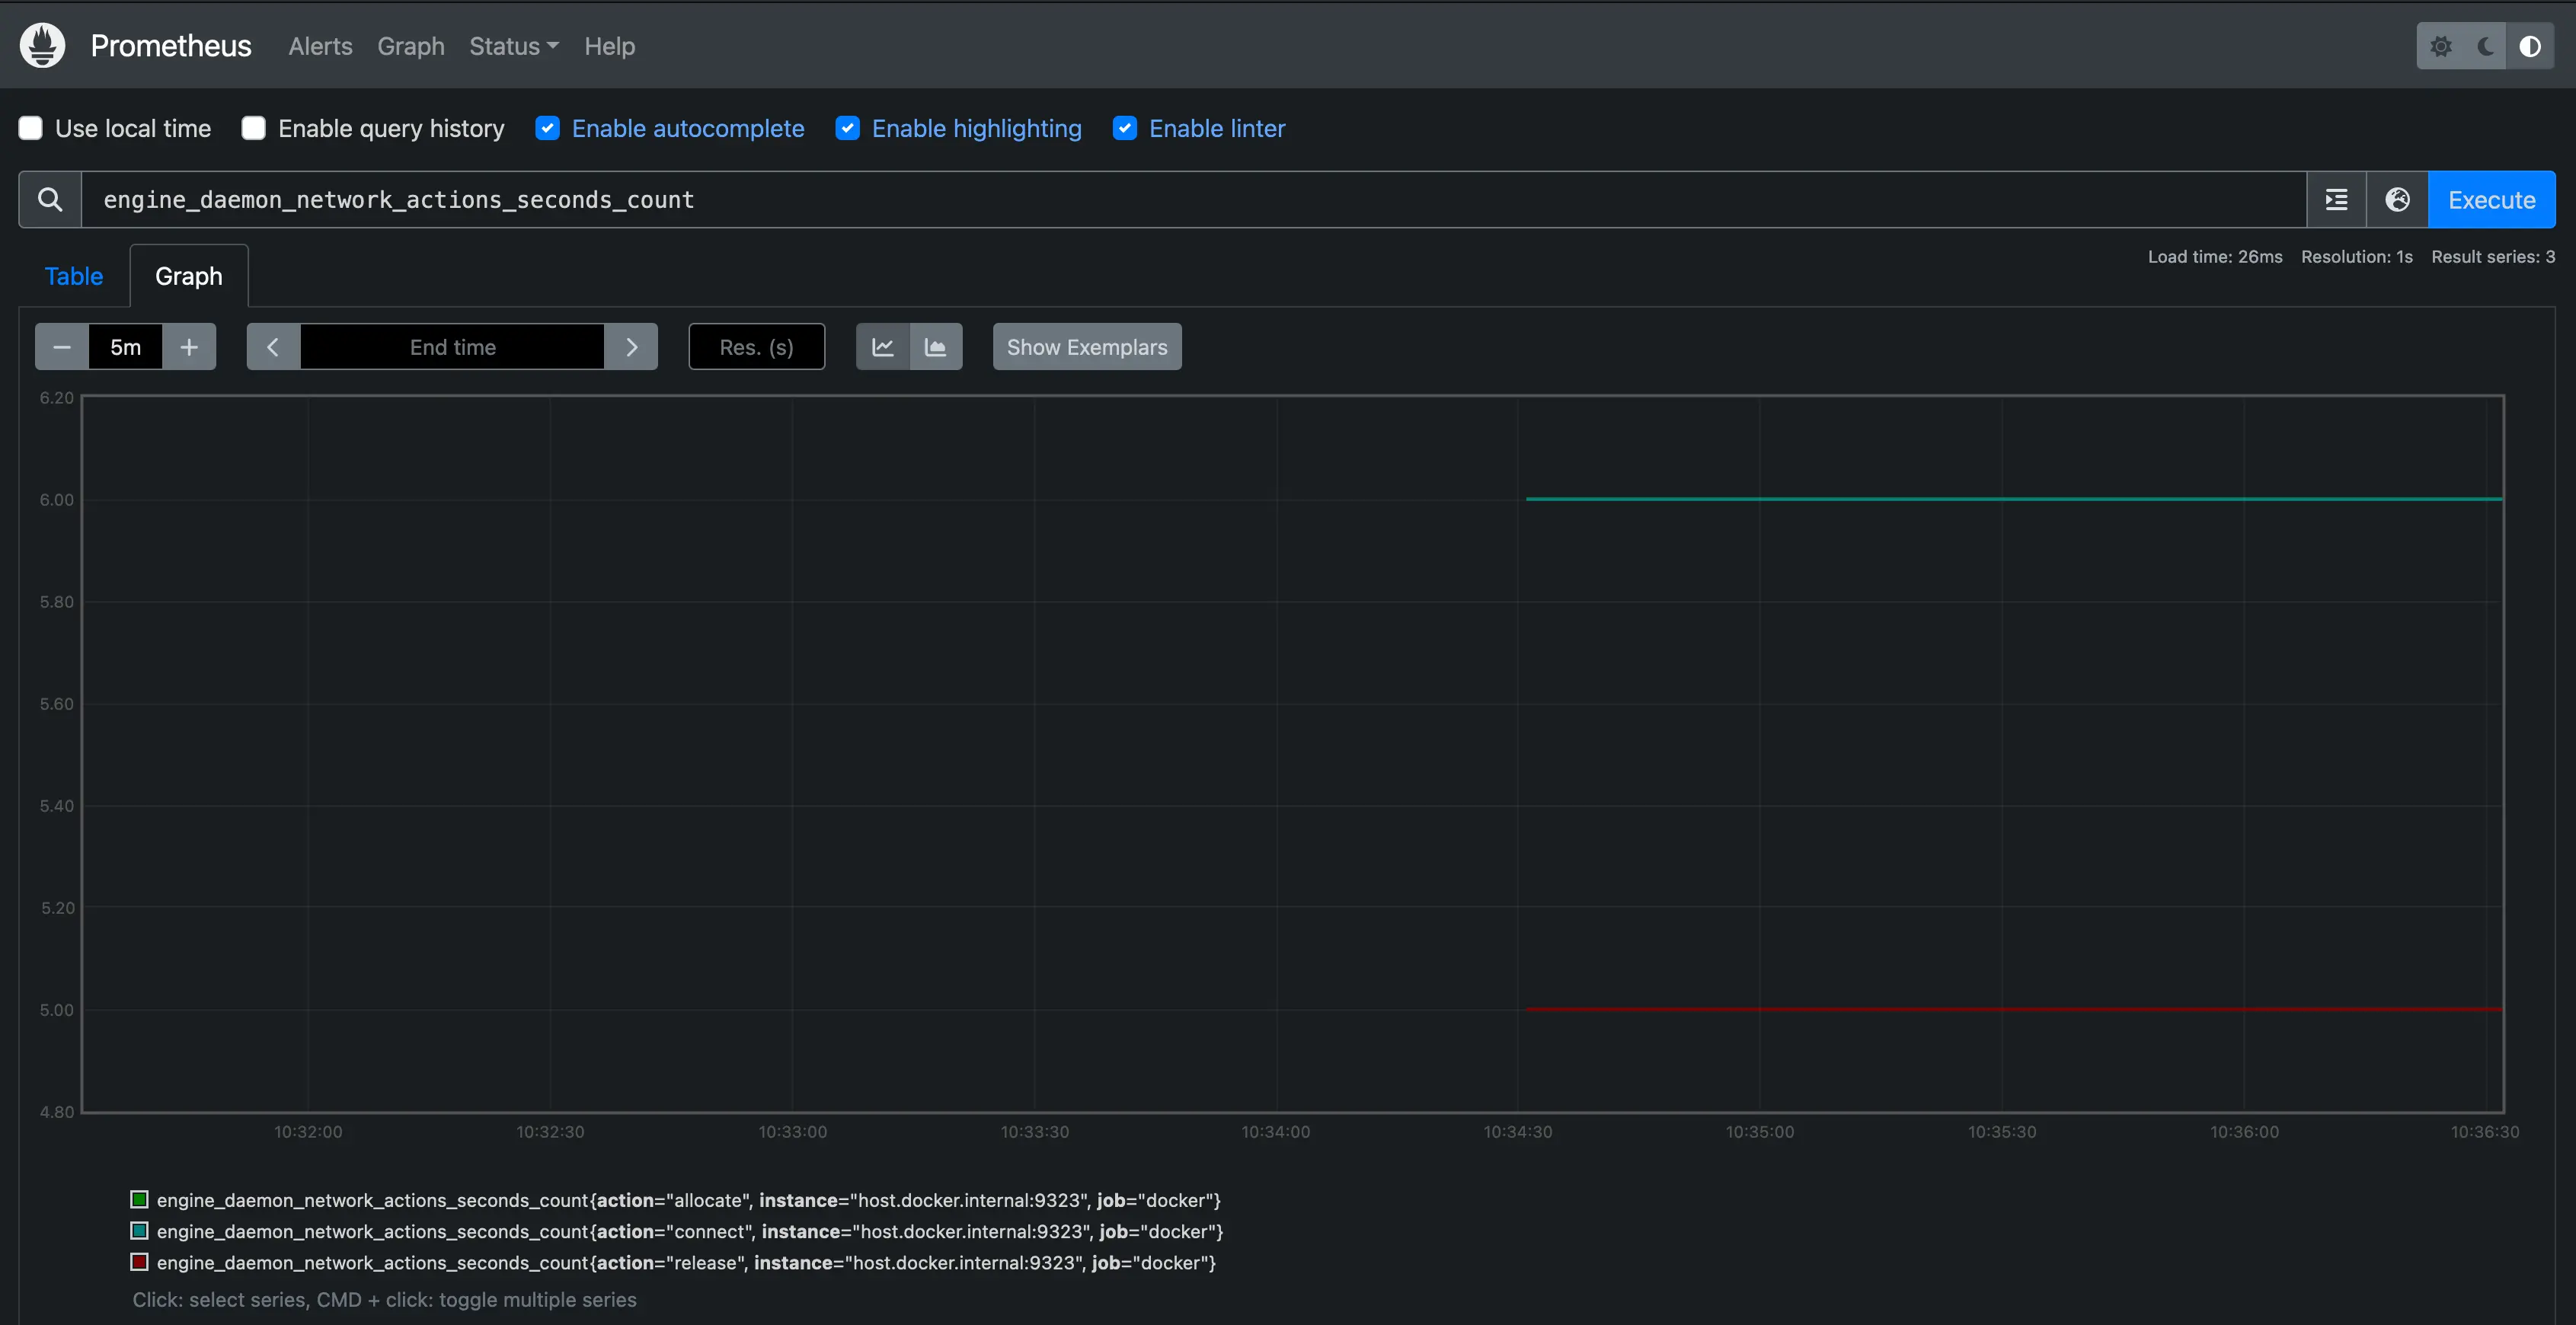
The graph shows a pretty idle Docker instance, unless you're already running active workloads on your system.
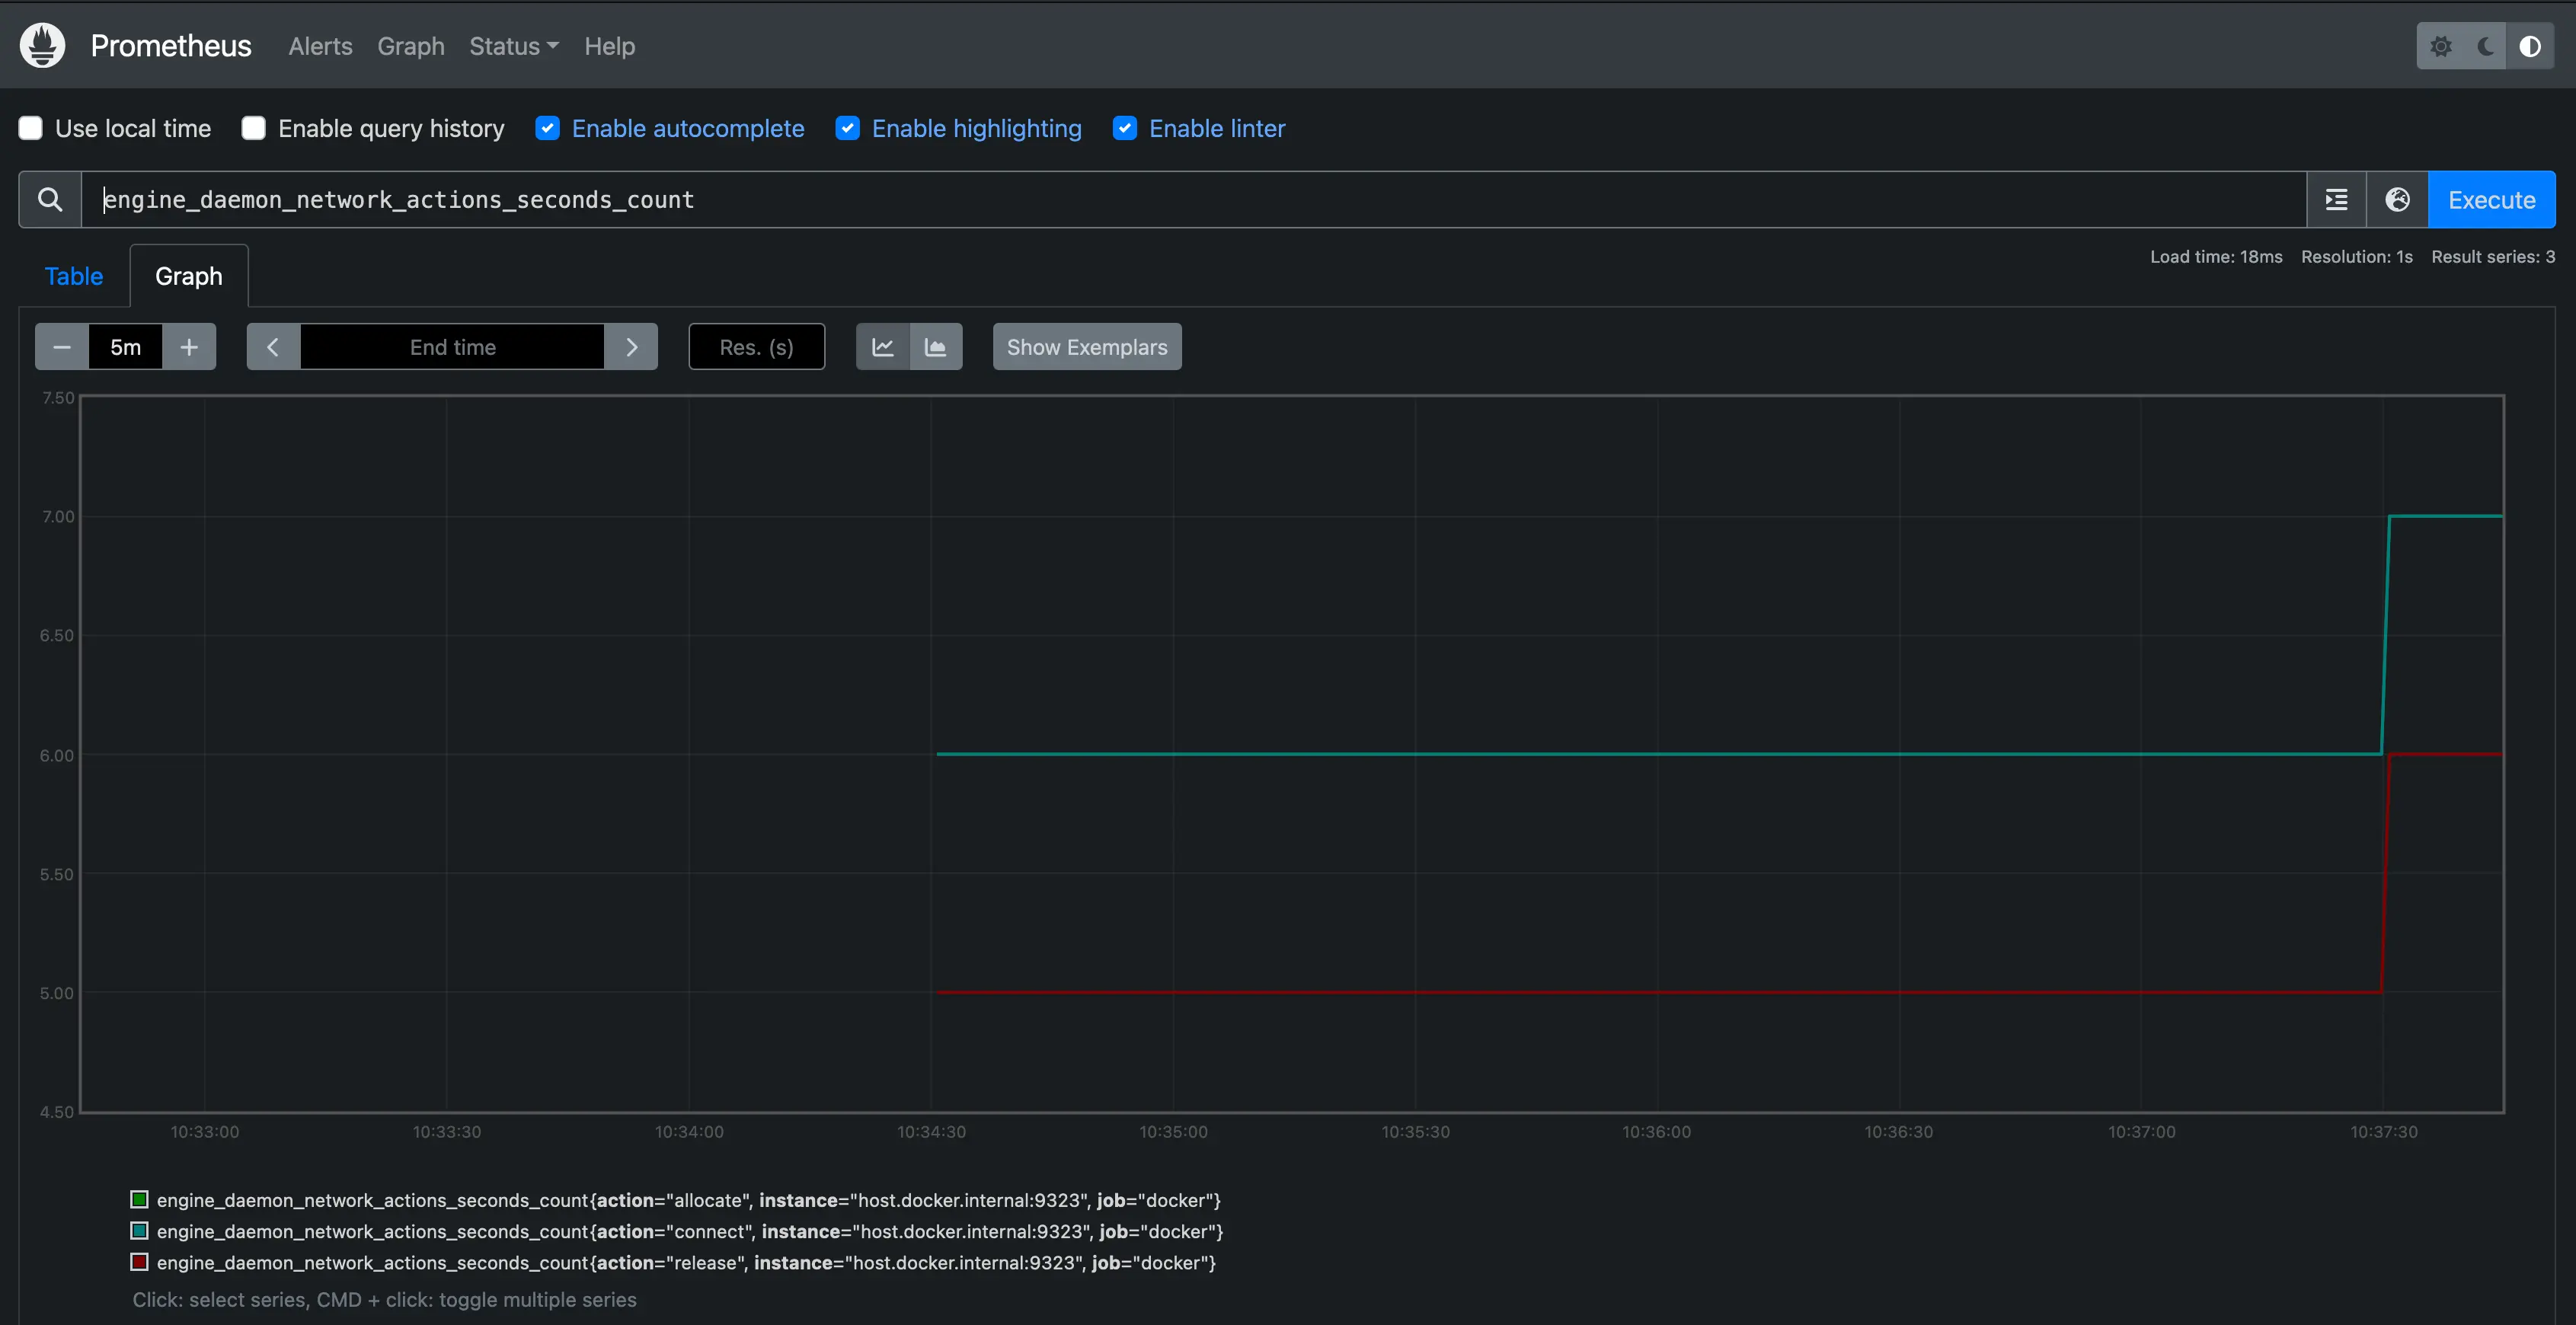
To make the graph more interesting, run a container that uses some network actions by starting downloading some packages using a package manager:
$ docker run --rm alpine apk add git make musl-dev go
Wait a few seconds (the default scrape interval is 15 seconds) and reload your graph. You should see an uptick in the graph, showing the increased network traffic caused by the container you just ran.
Next steps
The example provided here shows how to run Prometheus as a container on your
local system. In practice, you'll probably be running Prometheus on another
system or as a cloud service somewhere. You can set up the Docker daemon as a
Prometheus target in such contexts too. Configure the metrics-addr of the
daemon and add the address of the daemon as a scrape endpoint in your
Prometheus configuration.
- job_name: docker
  static_configs:
    - targets: ["docker.daemon.example:<PORT>"]
For more information about Prometheus, refer to the Prometheus documentation