Developing your application
In the last section, you saw how using Docker Compose, you can connect your services together. In this section, you will learn how to develop the Golang application with Docker. You will also see how to use Docker Compose Watch to rebuild the image whenever you make changes to the code. Lastly, you will test the application and visualize the metrics in Grafana using Prometheus as the data source.
Developing the application
Now, if you make any changes to your Golang application locally, it needs to reflect in the container, right? To do that, one approach is use the --build flag in Docker Compose after making changes in the code. This will rebuild all the services which have the build instruction in the compose.yml file, in your case, the api service (Golang application).
docker compose up --build
But, this is not the best approach. This is not efficient. Every time you make a change in the code, you need to rebuild manually. This is not is not a good flow for development.
The better approach is to use Docker Compose Watch. In the compose.yml file, under the service api, you have added the develop section. So, it's more like a hot reloading. Whenever you make changes to code (defined in path), it will rebuild the image (or restart depending on the action). This is how you can use it:
| |
Once you have added the develop section in the compose.yml file, you can use the following command to start the development server:
$ docker compose watch
Now, if you modify your main.go or any other file in the project, the api service will be rebuilt automatically. You will see the following output in the terminal:
Rebuilding service(s) ["api"] after changes were detected...
[+] Building 8.1s (15/15) FINISHED                                                                                                        docker:desktop-linux
 => [api internal] load build definition from Dockerfile                                                                                                  0.0s
 => => transferring dockerfile: 704B                                                                                                                      0.0s
 => [api internal] load metadata for docker.io/library/alpine:3.17                                                                                        1.1s
  .
 => => exporting manifest list sha256:89ebc86fd51e27c1da440dc20858ff55fe42211a1930c2d51bbdce09f430c7f1                                                    0.0s
 => => naming to docker.io/library/go-api:latest                                                                                                          0.0s
 => => unpacking to docker.io/library/go-api:latest                                                                                                       0.0s
 => [api] resolving provenance for metadata file                                                                                                          0.0s
service(s) ["api"] successfully built
Testing the application
Now that you have your application running, head over to the Grafana dashboard to visualize the metrics you are registering. Open your browser and navigate to http://localhost:3000. You will be greeted with the Grafana login page. The login credentials are the ones provided in Compose file.
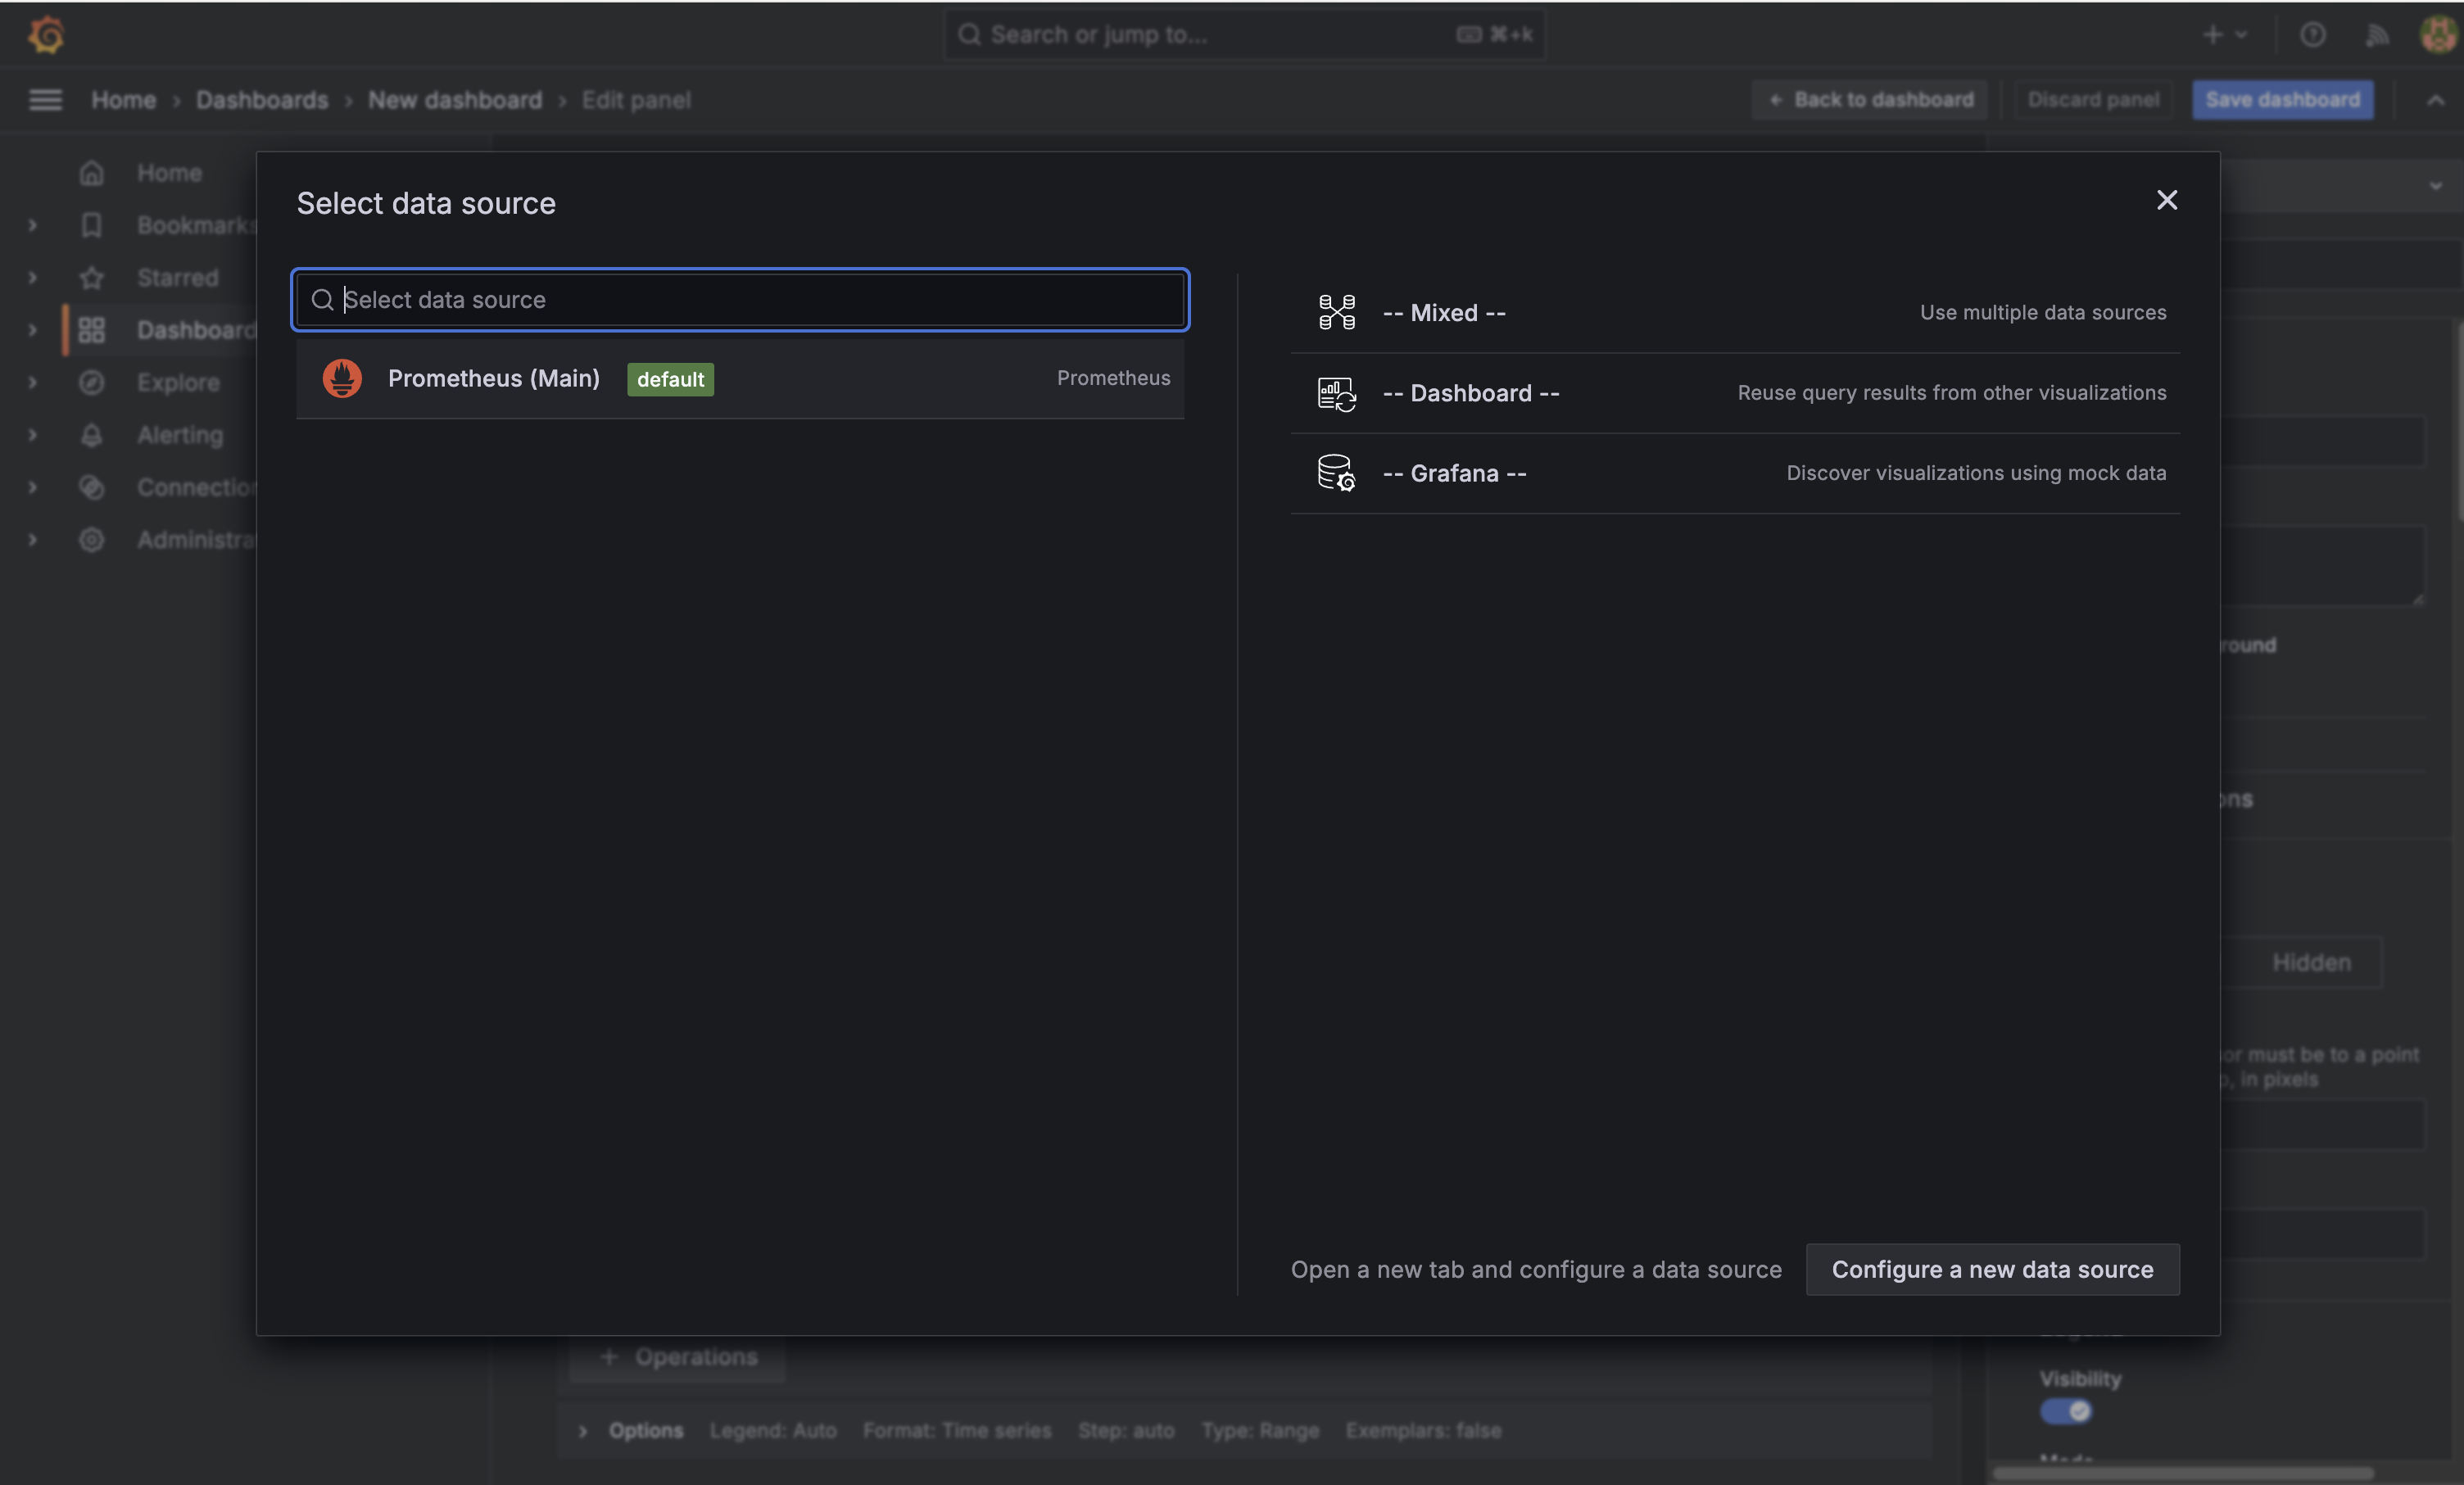
Once you are logged in, you can create a new dashboard. While creating dashboard you will notice that is default data source is Prometheus. This is because you have already configured the data source in the grafana.yml file.


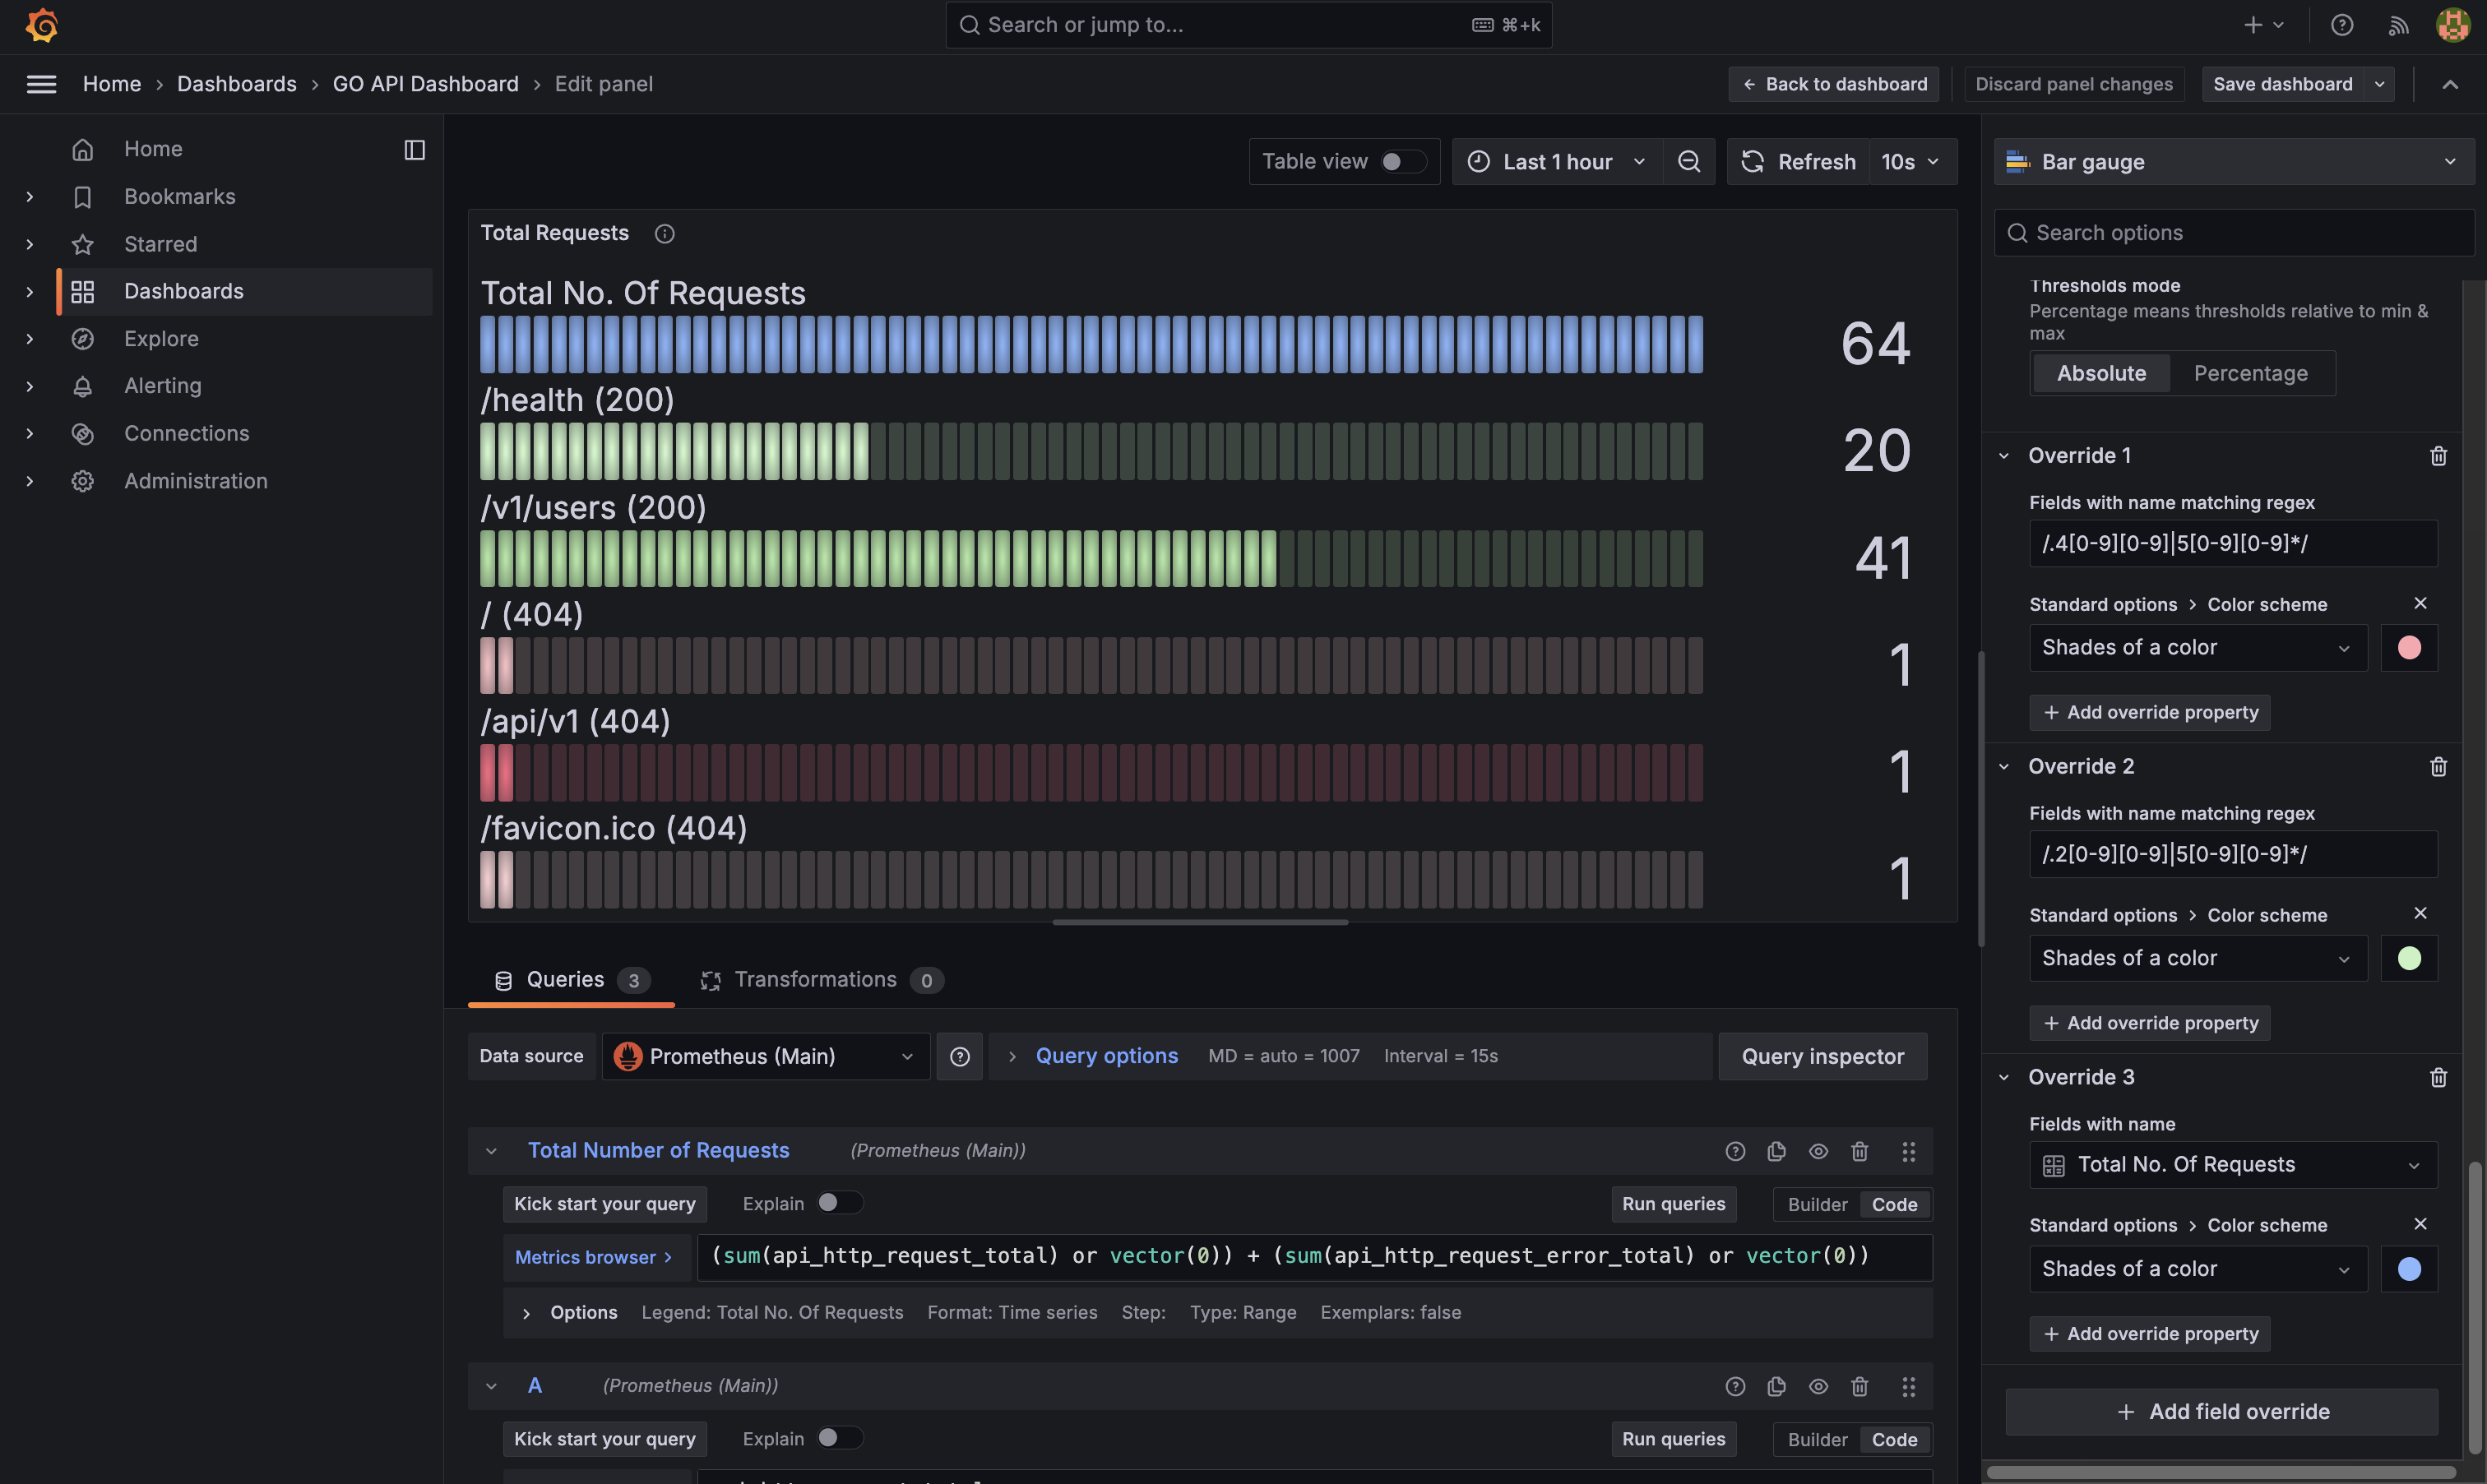
You can use different panels to visualize the metrics. This guide doesn't go into details of Grafana. You can refer to the Grafana documentation for more information. There is a Bar Gauge panel to visualize the total number of requests from different endpoints. You used the api_http_request_total and api_http_request_error_total metrics to get the data.


You created this panel to visualize the total number of requests from different endpoints to compare the successful and failed requests. For all the good requests, the bar will be green, and for all the failed requests, the bar will be red. Plus it will also show the from which endpoint the request is coming, either it's a successful request or a failed request. If you want to use this panel, you can import the dashboard.json file from the repository you cloned.
Summary
You've come to the end of this guide. You learned how to develop the Golang application with Docker. You also saw how to use Docker Compose Watch to rebuild the image whenever you make changes to the code. Lastly, you tested the application and visualized the metrics in Grafana using Prometheus as the data source.